Attach - Attach & step through remote requests
Here’s an example of attach configurations for JavaScript and XQuery:
    {
      "type": "ml-jsdebugger",
      "request": "attach",
      "name": "Attach to Remote JavaScript Request",
      "debugServerName": "jsdbg",
      "path": "${workspaceFolder}/src/main/ml-modules/root"
    },
    {
      "type": "xquery-ml",
      "request": "attach",
      "name": "Attach to XQY Debug request",
      "root": "${workspaceFolder}/plugins"
    }
Attach mode intercepts a paused request in a given debug server, an App Server connected to the VS Code debugger. To connect to an App Server for debugging:
- open the command palette, start typing MarkLogic: Connect... until autocomplete prompts you with
MarkLogic: Connect JavaScript Debug ServerorMarkLogic: Connect XQuery Debug Server, and choose the command you want. - You’ll be prompted to choose a server. Use the name of the App Server in the MarkLogic configuration, not its hostname or IP address.
- You should see a confirmation message once you’re connected
Connecting a server will automatically pause all requests so that you can attach the debugger. When you’re done, use either MarkLogic: Disconnect... command to disable debugging and resume handling requests as normal. Note that while the server is in “Connect” mode, you should not change any of the configured ports to the port number of the connected server. This will cause requests from the plugin to pause, leading to unexpected results.
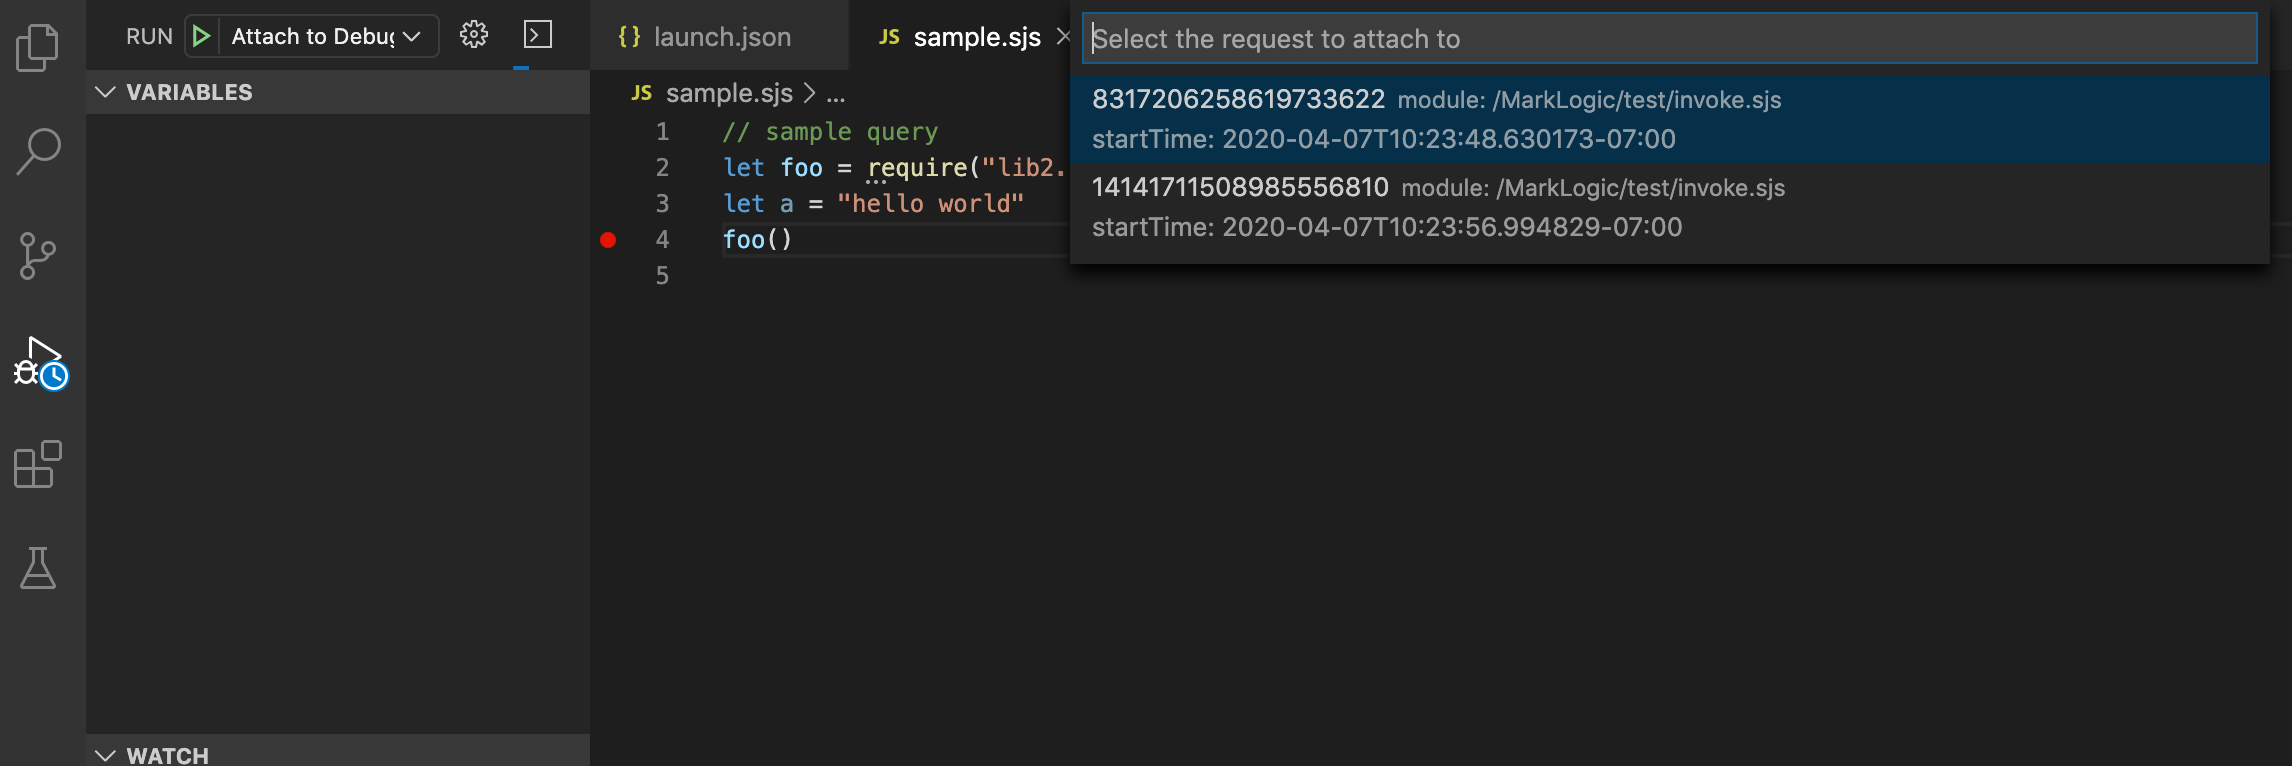
Once you start debugging, a dropdown menu will pop up listing all paused requests on the debug server. Choose the one you want to debug.
Note: Only requests that are launched after a server is connected/made debug server can be attached.

Use the optional parameter rid to specify a request ID in advance and avoid being prompted for it.
In attach mode for JavaScript, debugServerName is a required parameter in the launch.json. This should be the same server (by name) that you connected to in the Attach section. XQuery attach mode will simply list all attachable queries.
Notes
Debugger module mapping
In order to step through modules that get imported in your code, you need to tell the debugger where to find the modules root in your local project. This is the path parameter (for JavaScript) and root (for XQuery). These parameters are required.
In order to step into the built-in MarkLogic modules, create a soft link in the root of your source directory to the Modules/MarkLogic directory in your local MarkLogic install. For example, from the root directory of your source files, use the following command:
ln -s <path-to-marklogic-install>/Modules/MarkLogic .
JavaScript Import/Require paths
The JavaScript debugger does not reliably follow relative paths in import/require statements. This is because relative paths are an anti-pattern with MarkLogic since modules are stored with absolute paths as URIs. We recommend using absolute paths for greater code clarity.
Debugging Limitations
In XQuery attach-mode debugging, you should not ‘connect’ to the same server you use for queries. Since connecting stops all requests on that App Server, you’d lock yourself out. For this reason, the extension will not offer to connect to your configured query client’s port. Admin, Manage, HealthCheck, and App-Services are also excluded from debugging.
Due to the nature of XQuery, the XQuery debugger functions a bit differently than many developers are accustomed to. Multiple lines of XQuery may be reported as a single expression by the MarkLogic debugger functions. Since the three primary stepping functions, Step Over, Step Into, and Step Out, all operate based on XQuery expressions, using those functions does not have the same result as using those functions in the JavaScript debugger.
Step Overcontinues evaluation of the request until the beginning or end of an expression that is not a descendant of the current expression.Step Intocontinues evaluation of the request until the beginning or end of an expression. Using this function most closely resembles the expected functionality of a debugger.Step Outcontinues evaluation of the request until the end of the current expression.
Watch expressions do not currently work with the XQuery debugger.
‘Launch’ debugging initiated from an unsaved (‘Untitled’) buffer in VS Code will not work. If you want to launch and debug an ad-hoc query, save it somewhere on disk beforehand.
Neither debugger can cross from one server-side language mode into another. XQuery debugging cannot step into xdmp:javascript-eval() calls, and JavaScript debugging cannot step into xdmp.xqueryEval(). The debugger should step over these calls if you try to step into them.
Evaluating variables in module scope may throw reference error. Possible workarounds:
- use the variables of interest inside a function, and inspect
- place an
eval()statement inside the affected module
While debugging an MJS file, variables and watch expressions do not work work as expected.
Resource Services do not pause as expected and therefore cannot currently be debugged.
If you encounter any issue with the debugger that is not addressed above, please open a ticket with steps for reproducing the issue.
Error Reporting
While every effort is made to catch and handle error conditions, unexpected errors do occur from time to time and must be handled by VS Code internally. Those errors are sometimes reported only in the debug console and that tab is not automatically given focus in the UI. This means that it can be easy to miss that an error has occurred. Therefore, if a feature does not seem to be working properly but no error popup is shown, then check the debug console for errors.