Getting Started Tutorial 2.x
Load the Product data As-Is
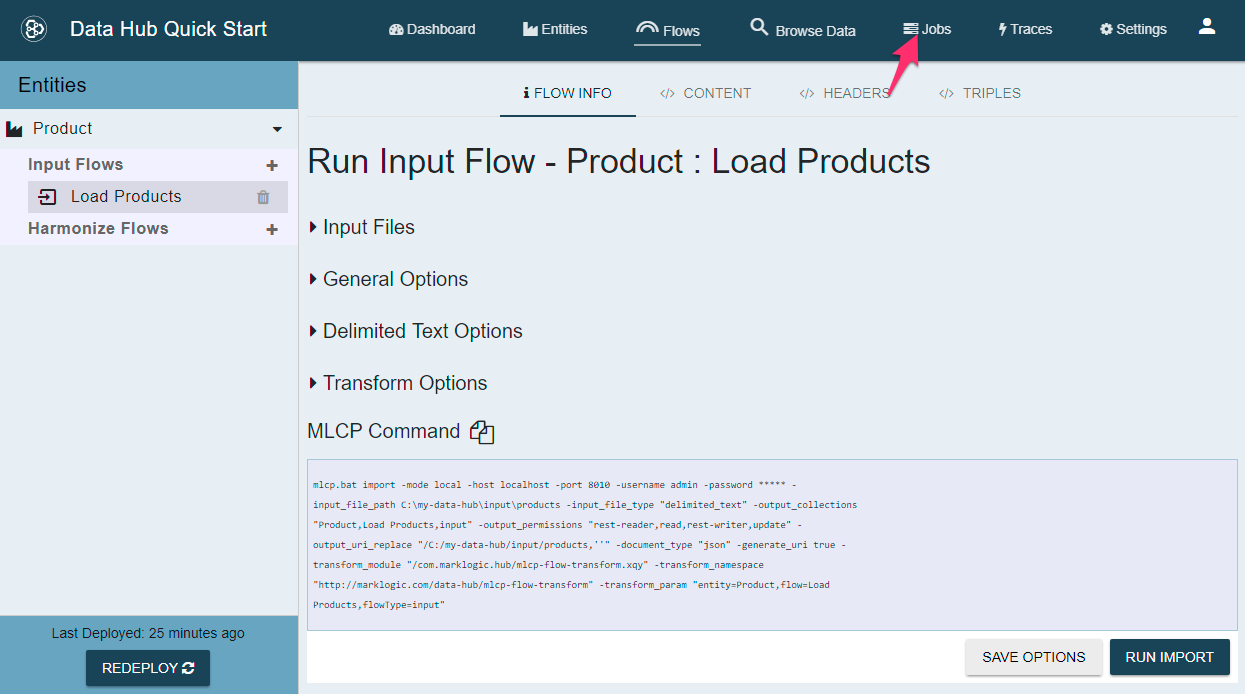
Now you will use the QuickStart Input Flow wizard to load the product data into MarkLogic. The QuickStart application will use the settings you are about to specify to run MarkLogic Content Pump MLCP for you. MLCP is a command line tool for loading large amounts of data into MarkLogic. This Input Flow Wizard is quite awesome because you don’t have to learn the intricacies of the MLCP command line to get started.
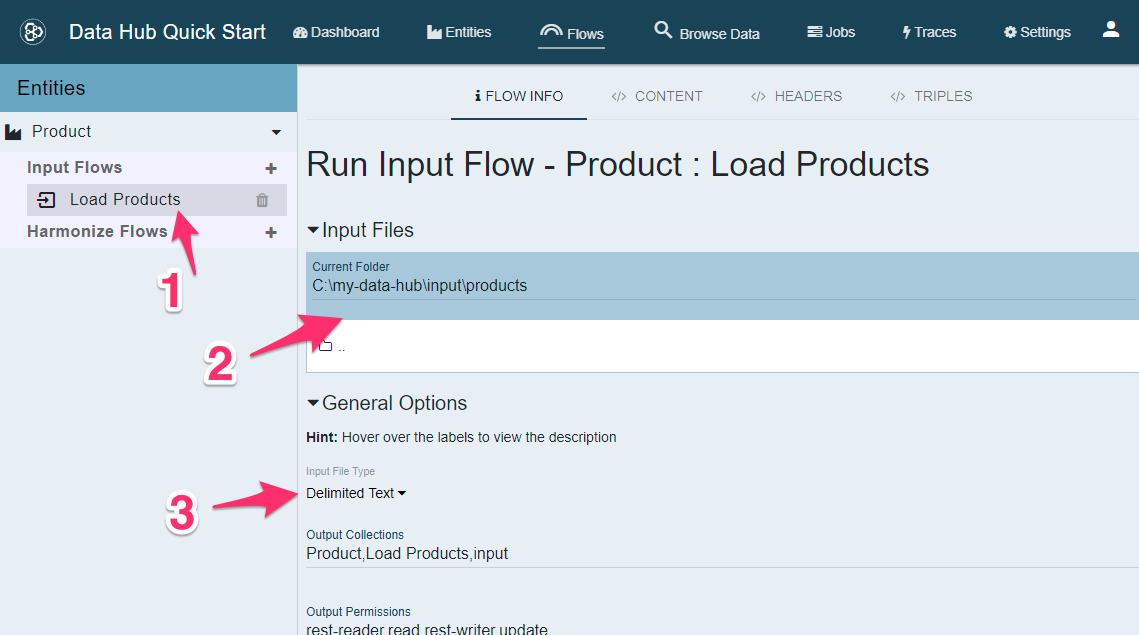
- Click on Load Products under Input Flows.
- Use the file browser to select the input\products directory.
- Under General Options, change Input File Type to Delimited Text.
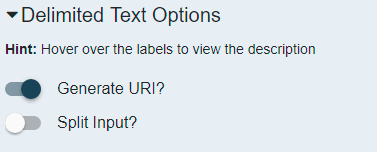
- Now expand Delimited Text Options and turn on Generate URI?.
This settings tells MLCP to generate a unique URI for every document it creates. Normally for CSV files it would use the value in the first column. If there are repeat values then we would end up overwriting documents. This ensures the uniqueness of the URIs.
To Recap, you should have set the following options:
- Input Files -> Current Folder -> c:\my-data-hub\input\products (adjust for your folder structure)
- General Options -> Input File Type -> Delimited Text
- Delimited Text Options -> Generate URI? -> ON
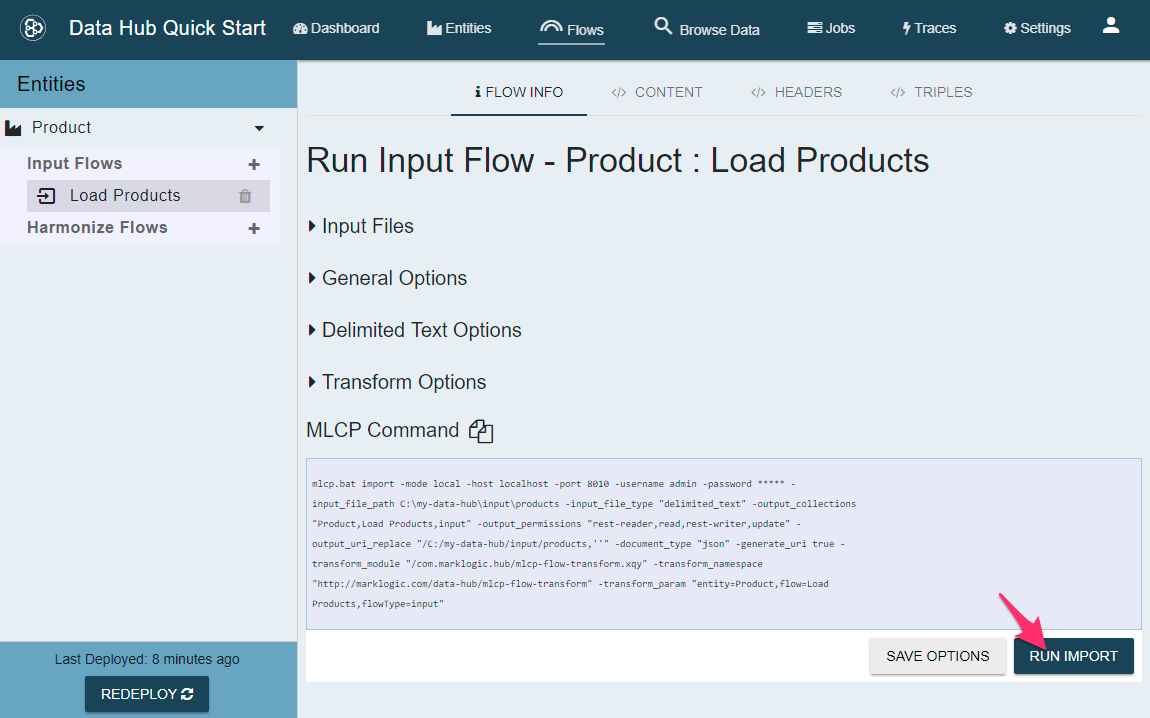
Finally, click the RUN IMPORT button to start the data load.
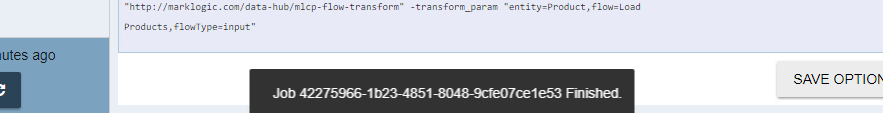
You will see a progress bar during the data load.

When it is finished you will see a toast (named such because it pops up load bread in a toaster) message indicating that the job completed.
Review Your Finished Job
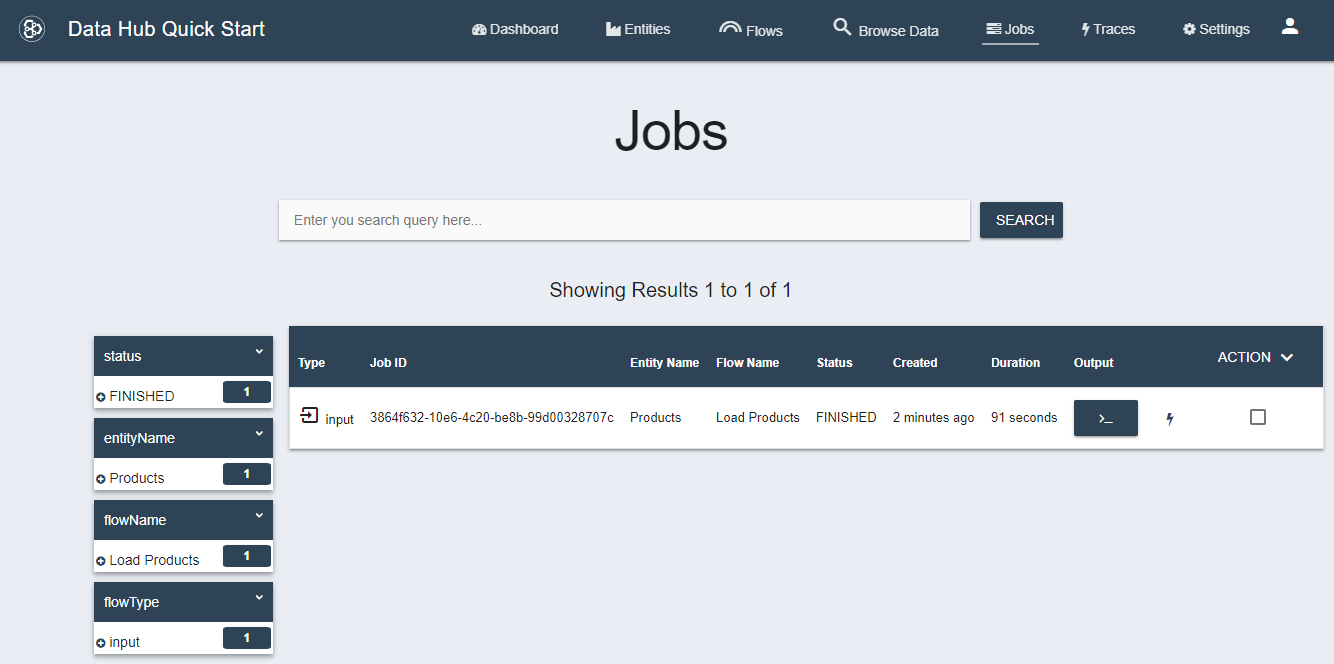
Let’s take a moment to look at the Jobs tab. Click the Jobs tab in the top navigation bar.
On the Jobs tab you will see a list of previously run jobs. This interface is searchable either via free text or via the facets on the left.
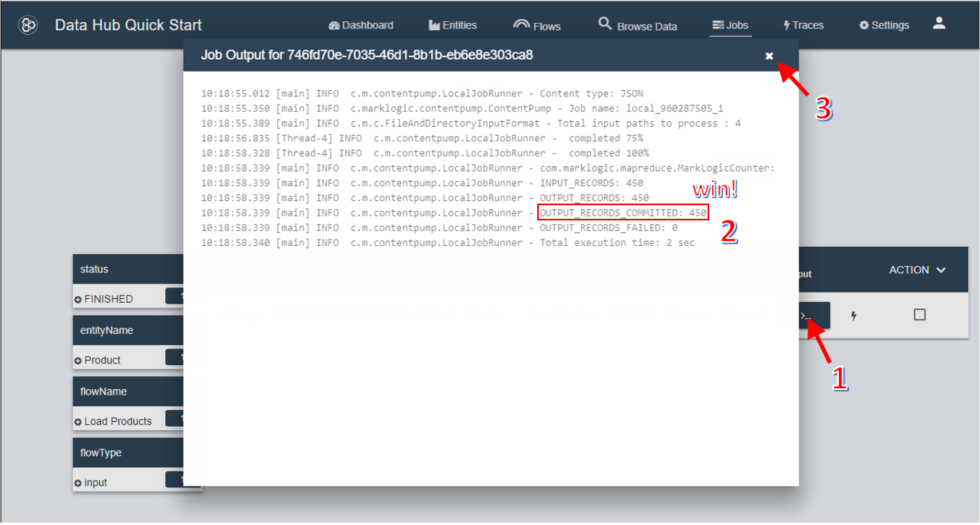
Let’s inspect the Output of MLCP.
Click on the >_ button to see the output.
If everything ran successfully you should see OUTPUT_RECORDS_COMMITTED: 450 in the output.
Now click on the x icon to close the dialog.
Inspect the Trace Logs for your Job
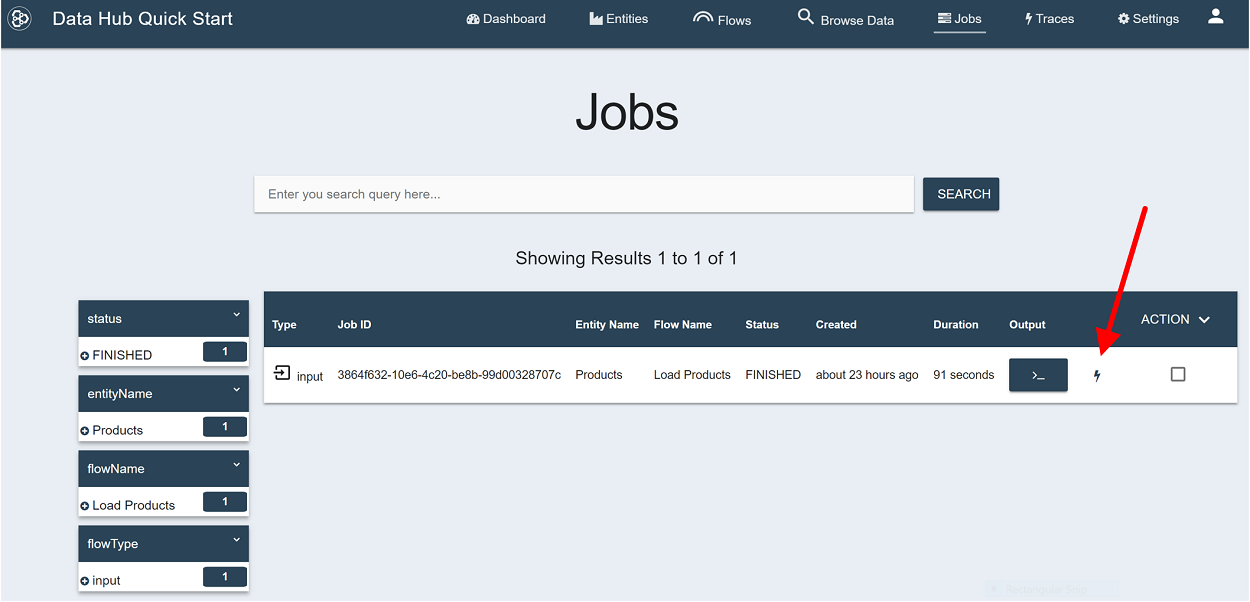
Now let’s look at the Trace Output for our Job. Tracing is a debugging feature that logs inputs and outputs to each of the plugins that run during a flow. This feature is useful for helping you see where along the chain something may have gone wrong.
Click on the dark blue lightning bolt icon on the far right of the Jobs table. This will show only traces for that Job. Alternatively, you can click on the Traces tab in the top navigation bar to see all Traces.
Similar to the Jobs tab, the trace tab offers Free text search and faceted navigation.
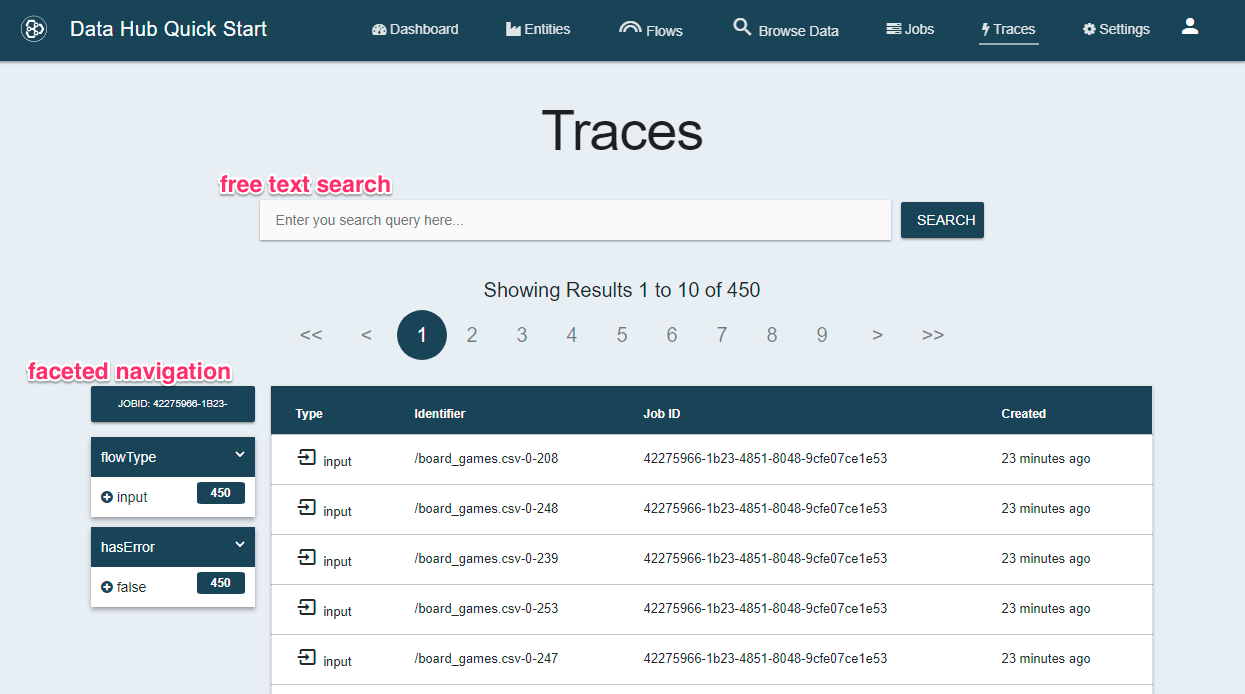
Click on one of the rows in the Trace table so see a detailed view of the trace.
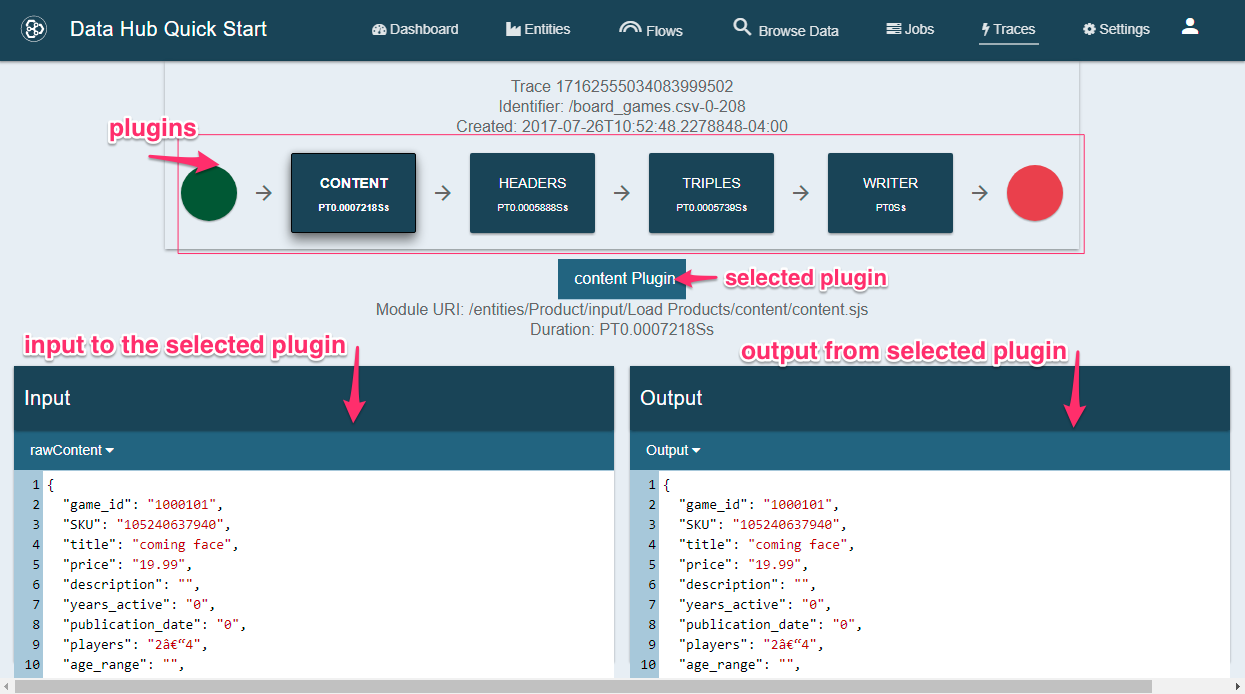
The Trace details view allows you to click on each plugin in the Flow to see the inputs and outputs. You can also see the identifier that was being processed as well as the time each plugin took to execute.
Up Next
Harmonizing Products > Browse and Understand the Product Data