Flow Tracing
Flow tracing produces a detailed view of the flows as they happened. For each plugin in a flow, the inputs and outputs to that plugin are recorded into the JOBS database. Flow tracing is great for debugging your flows because you can see exactly what came in and went out of each step. You can use flow tracing to track down bugs in your flows as well as performance issues.
Flow tracing can be enabled and disabled as needed. We recommend you disable flow tracing in production as there is a performance penalty for writing the additional trace information. Any uncaught exception will always result in a flow tracing event, regardless of whether tracing is currently enabled.
Flow tracing can be viewed with several UIs, described below.
Controlling Flow Tracing Events
A flag in the Modules database controls whether flow tracing is turned on. There are two ways to enable and disable flow tracing: using a gradle task, or via the QuickStart UI.
Enabling and Disabling via Gradle
In the directory where the project framework code lives, run these commands to enable/disable flow tracing:
Enable
./gradlew hubEnableTracing
gradlew.bat hubEnableTracing
Disable
./gradlew hubDisableTracing
gradlew.bat hubDisableTracing
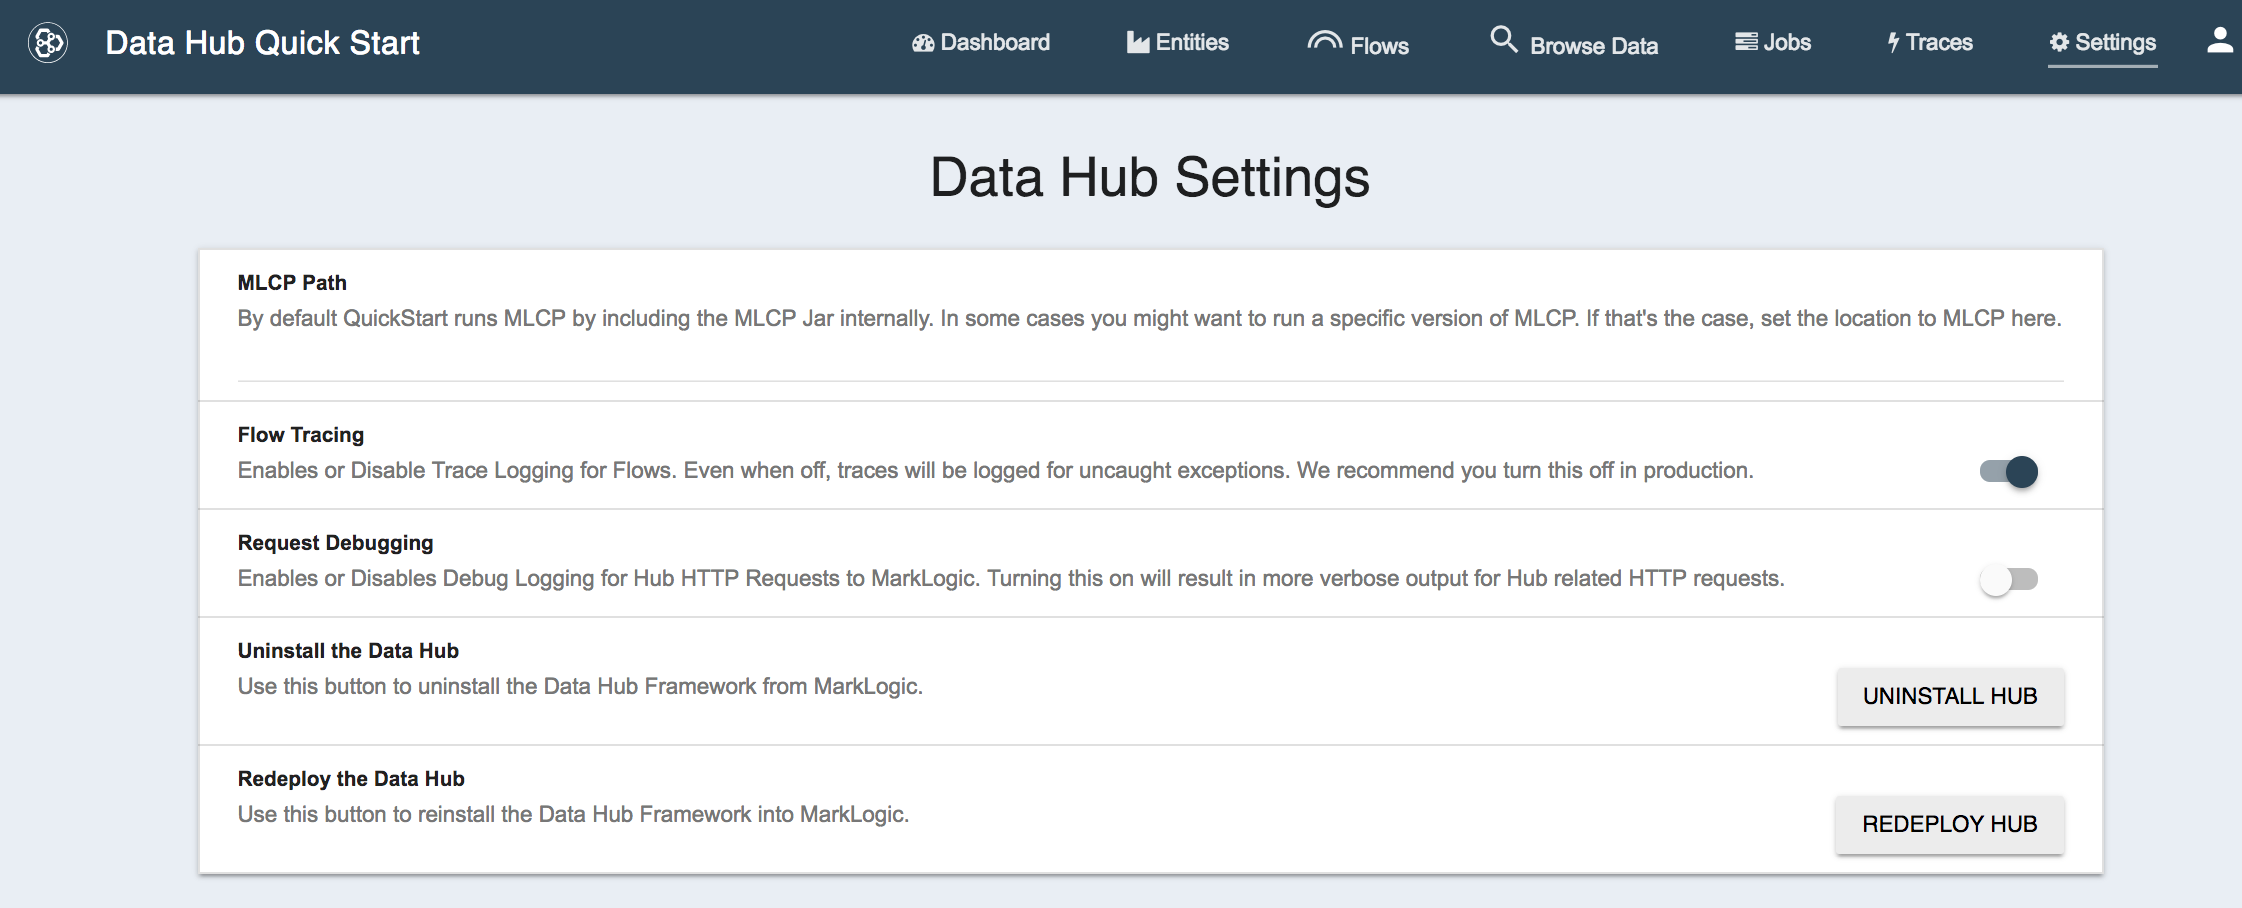
Enabling and Disabling via the Quickstart UI
Navigate to the Settings screen in QuickStart. On that page, you will find a selector to enable and disable flow tracing.
Flow Tracing Database
Initializing a project creates a JOBS database trace flow tracing events and job logs. By default, the database is called your-project-name-JOBS. The database is configured to index the text in trace events to facilitate searching this data.
Project initialization also creates an App Server attached to this database, called your-project-name-JOBS. By default, this App Server uses port 8013.
Viewing Flow Tracing
You can view flow tracing events in the following ways:
- In QuickStart: Click Traces in the QuickStart top navigation bar.
- Standalone: Navigate your browser to the Trace Viewer application. By default, the application is installed on port 8013 of your MarkLogic host.
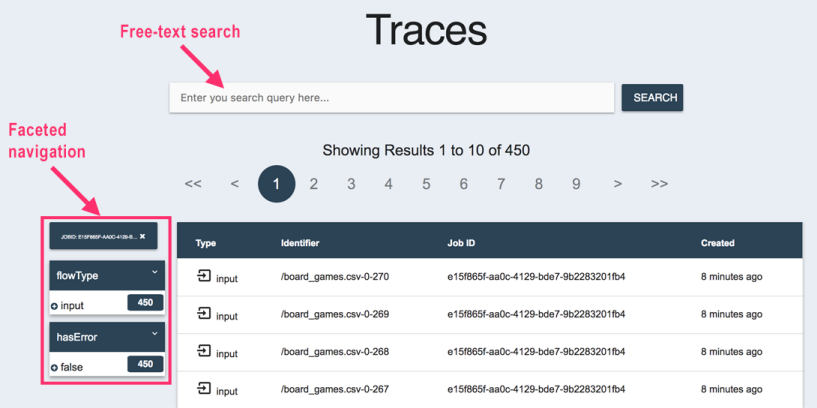
Both methods display a UI like the following. The viewer displays a list of all flow trace events in the JOBS database. You can search the text of trace events via the search bar and browse events via the facet navigation control on the left side.
Tracing logs inputs and outputs to each of the plugins that run during a flow. Clicking on a trace event displays the detailed flow for that event. For example:
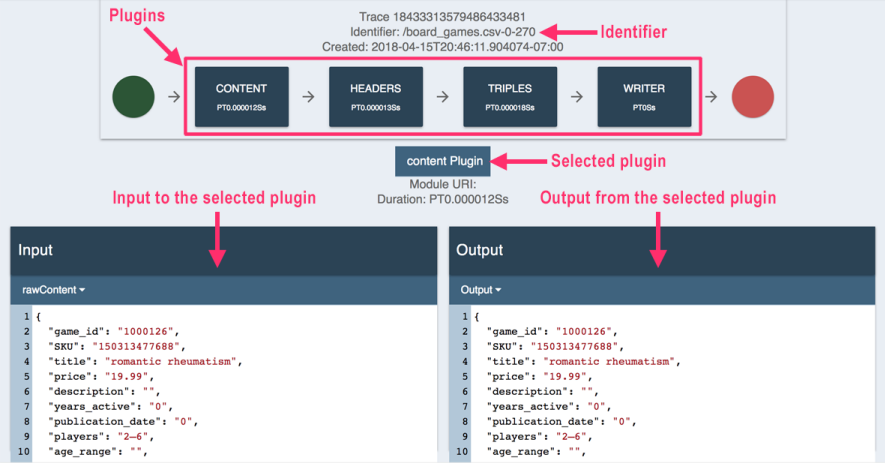
Across the top is the flow plugin pipeline. Clicking on a plugin displays its inputs and output.
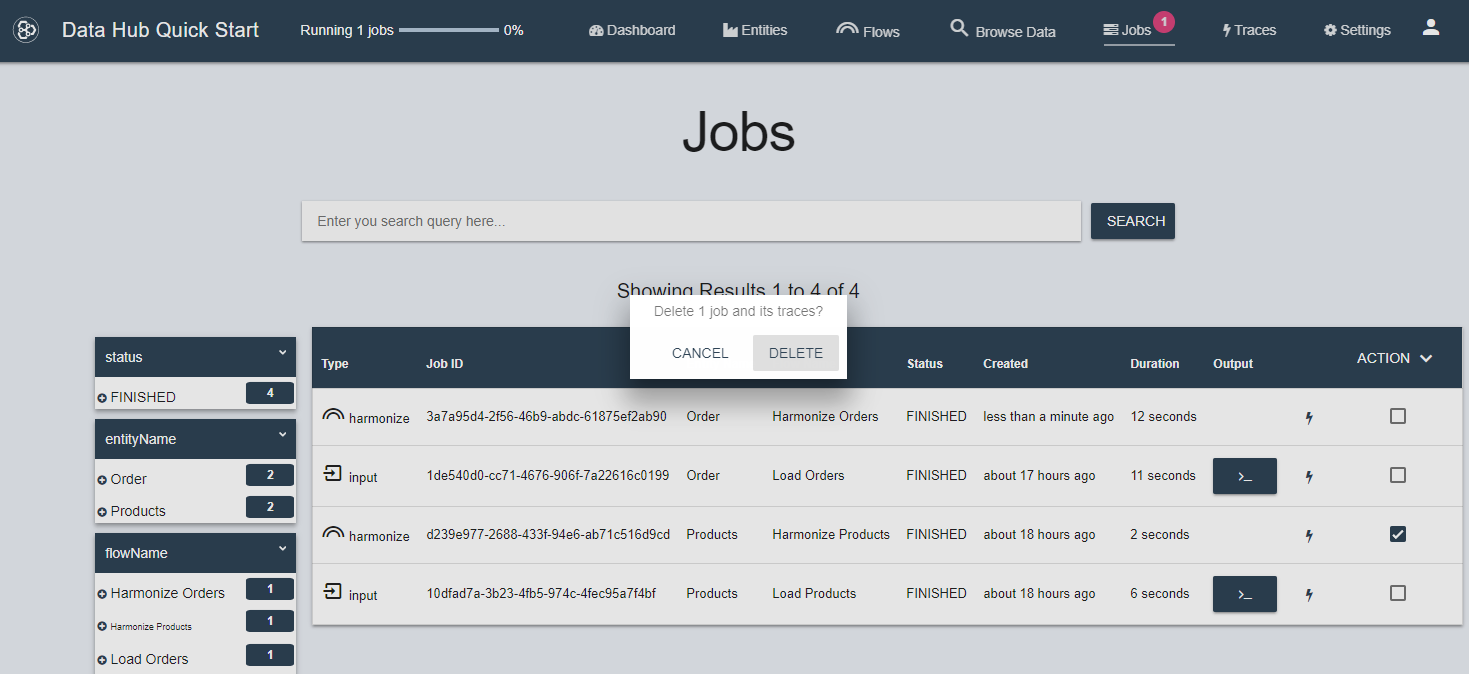
Cleaning up Traces
You can delete traces by deleting the job that created them. To do so, go to the Jobs page, click the checkboxes for the jobs you wish to delete, click ACTION, then select “Delete Jobs and Traces”. After confirming, the selected jobs and the associated traces will be removed from the JOBS databases.
Exporting Traces
You can export jobs and traces associated with those jobs. Go to the Jobs page, click the checkboxes for the Jobs you wish to export, click ACTION, then select “Export Jobs and Traces”. After confirming, the selected jobs and their associated traces will be exported to a zip file, which your browser will download. This feature is generally used to help communicate with MarkLogic’s support team.